This article showcases features generally available to Supervisor roles and above.
However, since Getac Enterprise is highly configurable, the ability to complete tasks described in this article may be different for each User, depending on policy. Please contact an administrator with all access questions and concerns.
Overview
The dashboard allows a user to see various data points about all Assets, Users, and Units.
See the video below for an introduction to navigating the dashboard:
Asset Status Bar
This bar provides information about Assets in their various states.
See the example below:

All numbers (other than zero) are clickable links that will take the User to a report for the data listed, e.g. Uncategorized shows a list of all uncategorized videos.
Overview
- Transferring - Assets that are currently being uploaded to the server.
- Failed - Assets that were unsuccessful in uploading.
Note:
The server will continue to attempt to upload and process failed Assets. If this number persists, contact Getac Video Support for assistance at [email protected].
- Queued more than 7 days - Assets that the server is aware of, but are unable to be uploaded.
Note:
Typically, this is due to a network error that requires network troubleshooting by an administrator. Getac does not directly troubleshoot customer networks.
- Uncategorized - Assets that have not been categorized and have a default Retention time.
Note:
The default Retention time is specified by an administrator at the time of setup and can be changed as Agency policy dictates.
- Trash - Assets that have finished their retention time remain in the trash for the time specified in an assigned Grace Period.
Caution:
Grace period is not setup by default and must be setup by an administrator. Assets that run their Retention period without a Grace Period setup will delete momentarily after moving to the trash. Be sure to configure a grace period that adequately covers the time needed to manage an Asset or Asset Group. Getac is not responsible for data loss due to improper setup of an Agency's Retention periods.
- Delete less than 72 hours - Assets that are at the last 3 days of retention time.
Note:
Asset Retention time can be extended up to indefinitely, which is covered here.
Unit Status Bar
The Unit status bar provides information about all Units and their various states.
Real-time data requires Units to have an active internet connection and connectivity back to the server.
See the example below:

Overview
- Stand by - Units that are in their initial power up phase. Once the Unit is running, they change to Online w/ GETAC.
- Online w/ GETAC - Units that are currently running MVS or MasterDock software and are actively reporting to Getac Enterprise.
- Capturing - Units that are actively recording an Asset.
- Live Video - Number of Units currently being viewed live by authorized Users. This can include MVS, Interview Room, and BWC solutions.
Note:
Livestream capability is only supported on DVR and BWCs with LTE capability.
- Offline > 7 Days - Units that have not reported to Getac Enterprise in over a one-week period.
Assets Captured Graph
This graph provides a visual representation of the various types of Assets being ingested into Getac Enterprise for the date range specified.
See the example below:
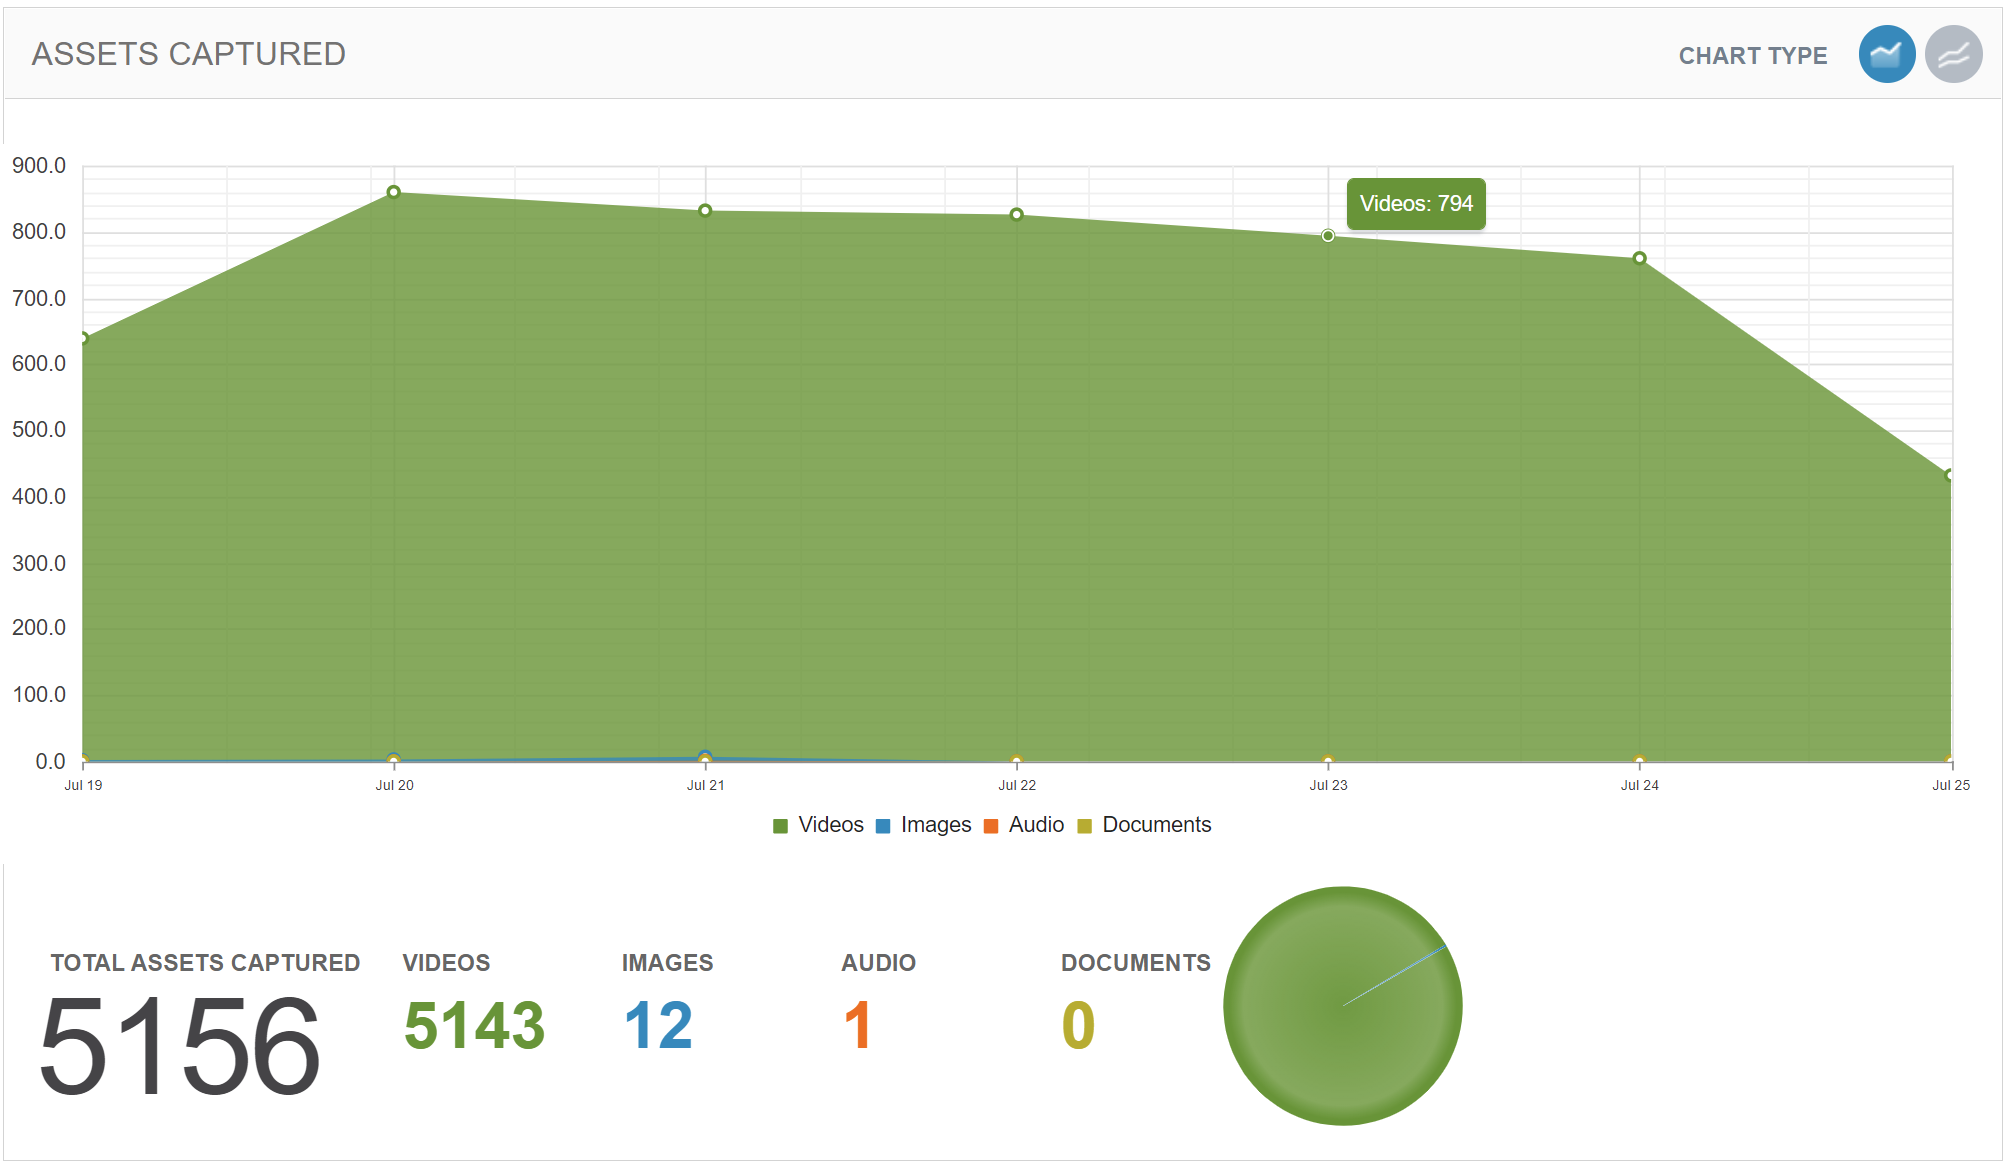
- Click on the Chart Type button to switch between area and line graphs.
- Hover over different parts of the line/area or pie graph for more information about a particular data point.
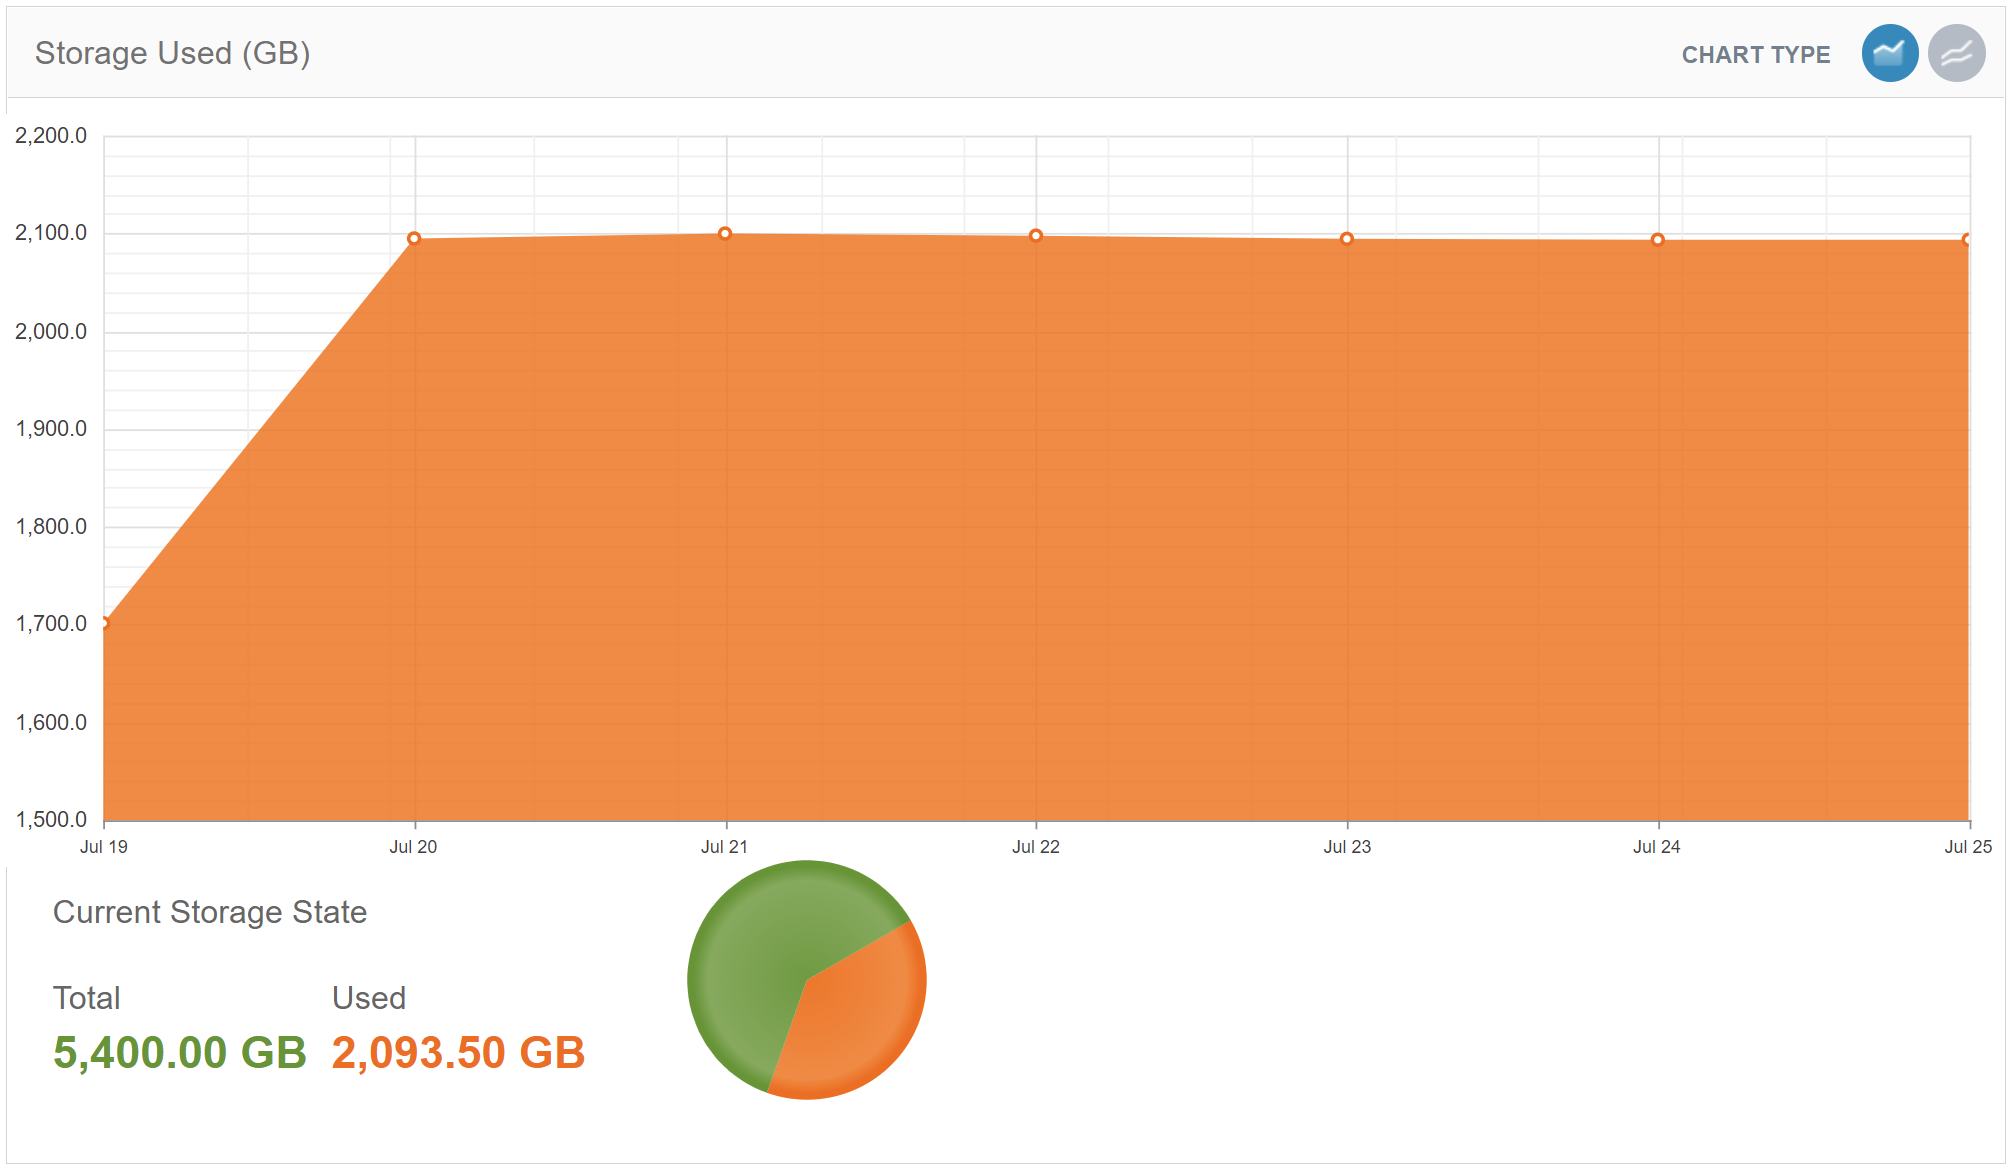
Storage Used Graph
This graph provides a visual representation of how much data is currently being used vs how much is available. Storage is measured in gigabytes (GB).
See the example below:
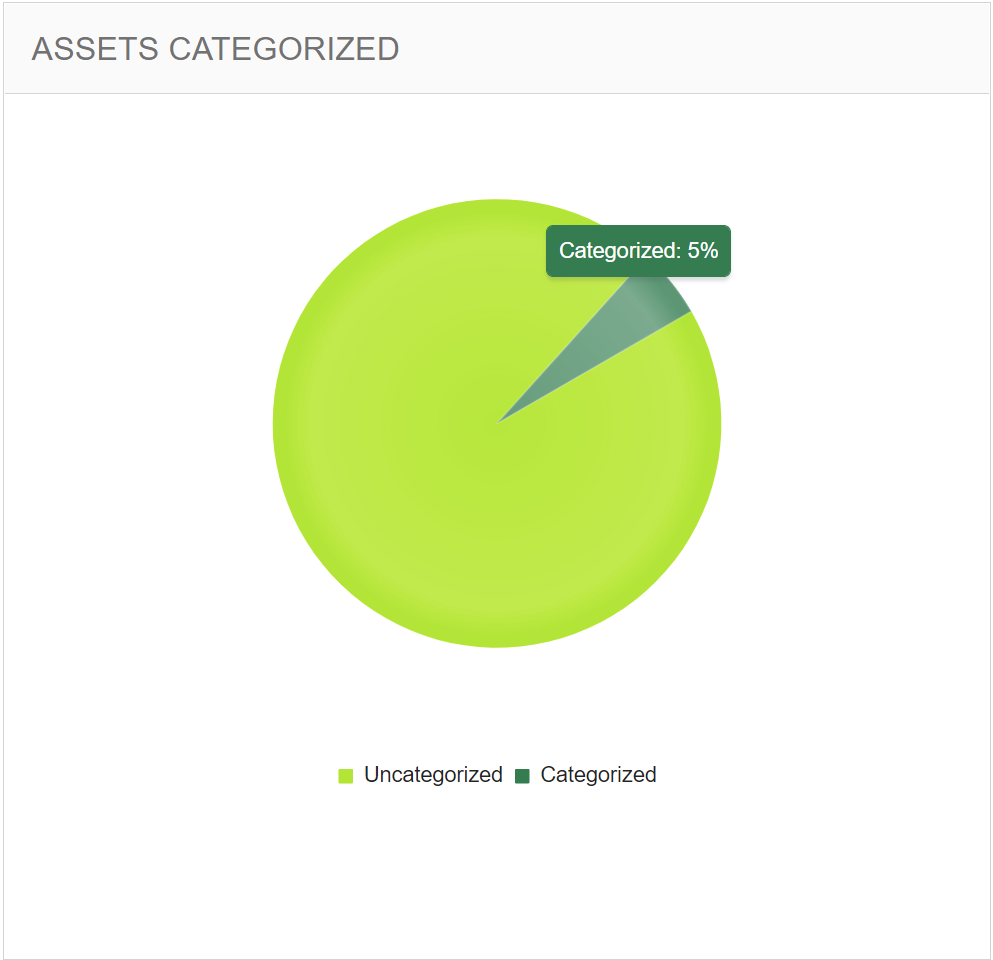
Assets Categorized Graph
This graph provides a look at which percentage of all Assets have an applied Category vs those that do not. Hover over to see the specific percentages.
See the example below:
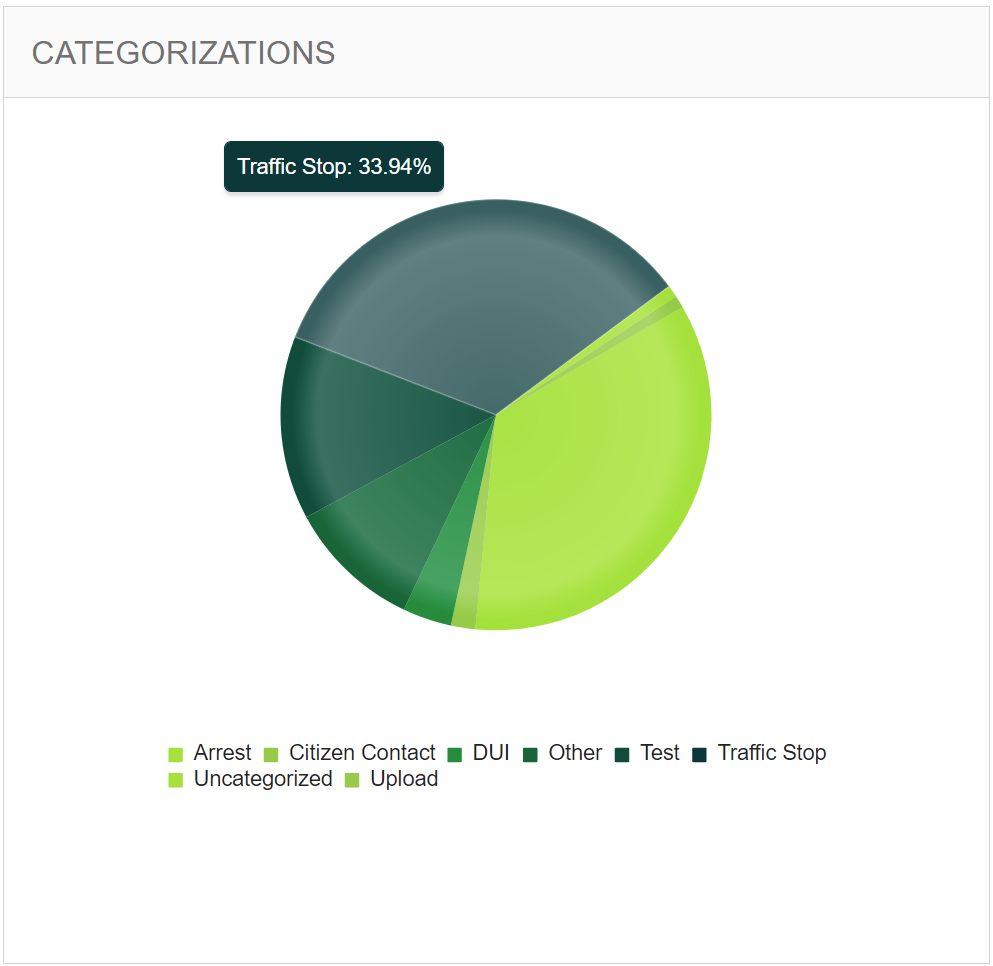
Categorizations Graph
This graph provides a look at which percentage of Categories that have been applied to all Assets. Hover over to see the specific percentages for each Asset.
See the example below:
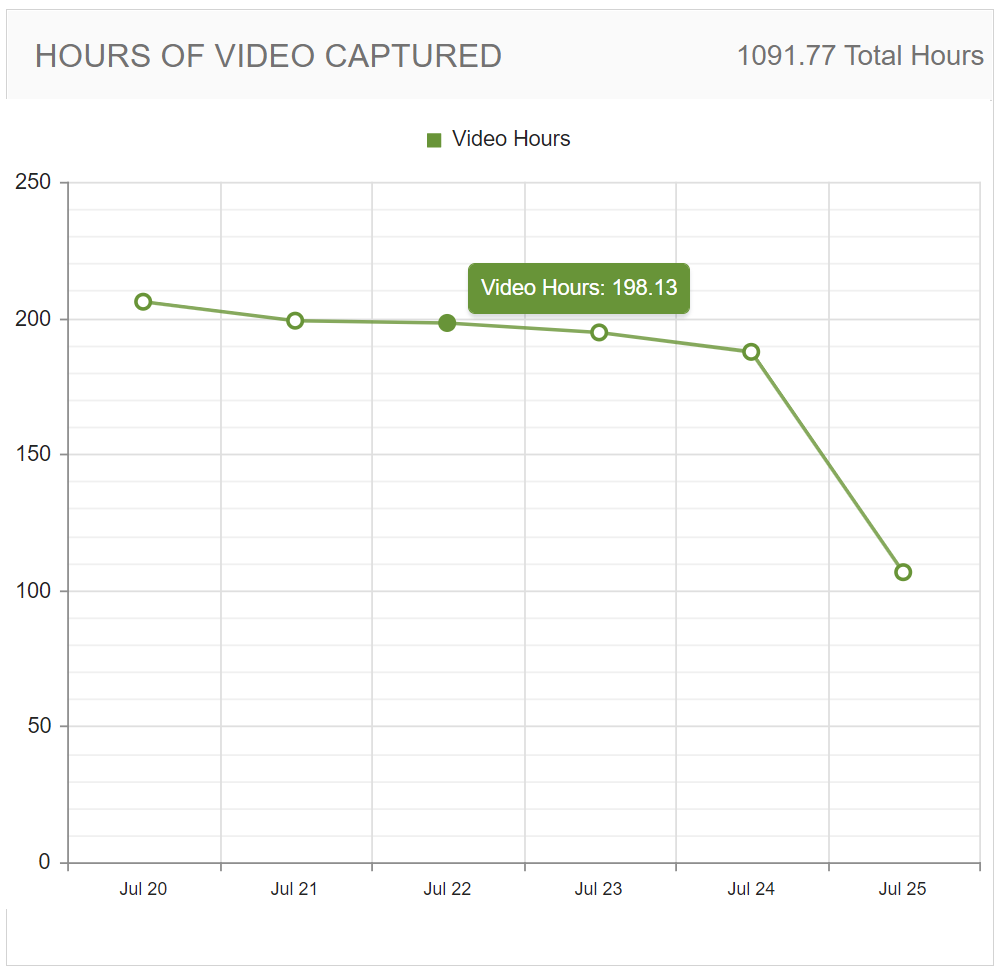
Hours of Video Captured
This graph provides a visual representation of how many total hours of video were captured each day over the period specified.
See the example below:
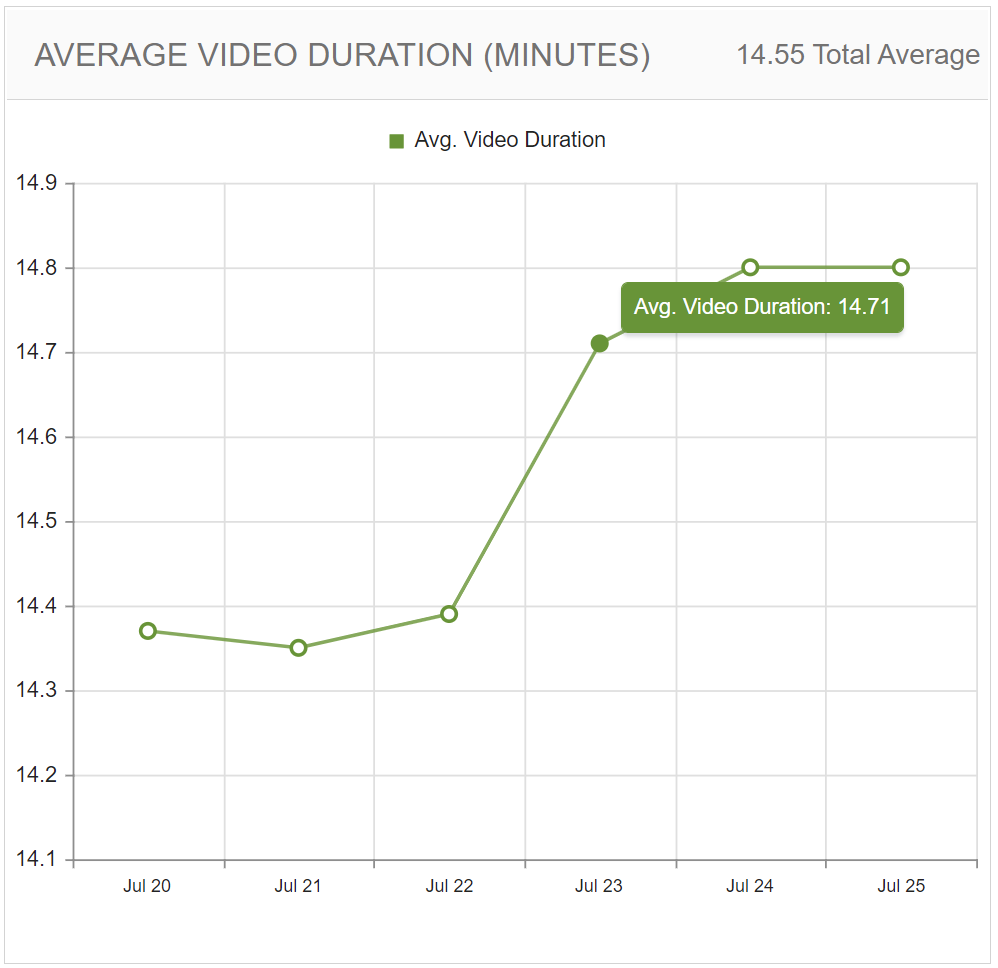
Average Video Duration Graph
This graph provides a visual representation of the average video length each day over the period specified.
See the example below:
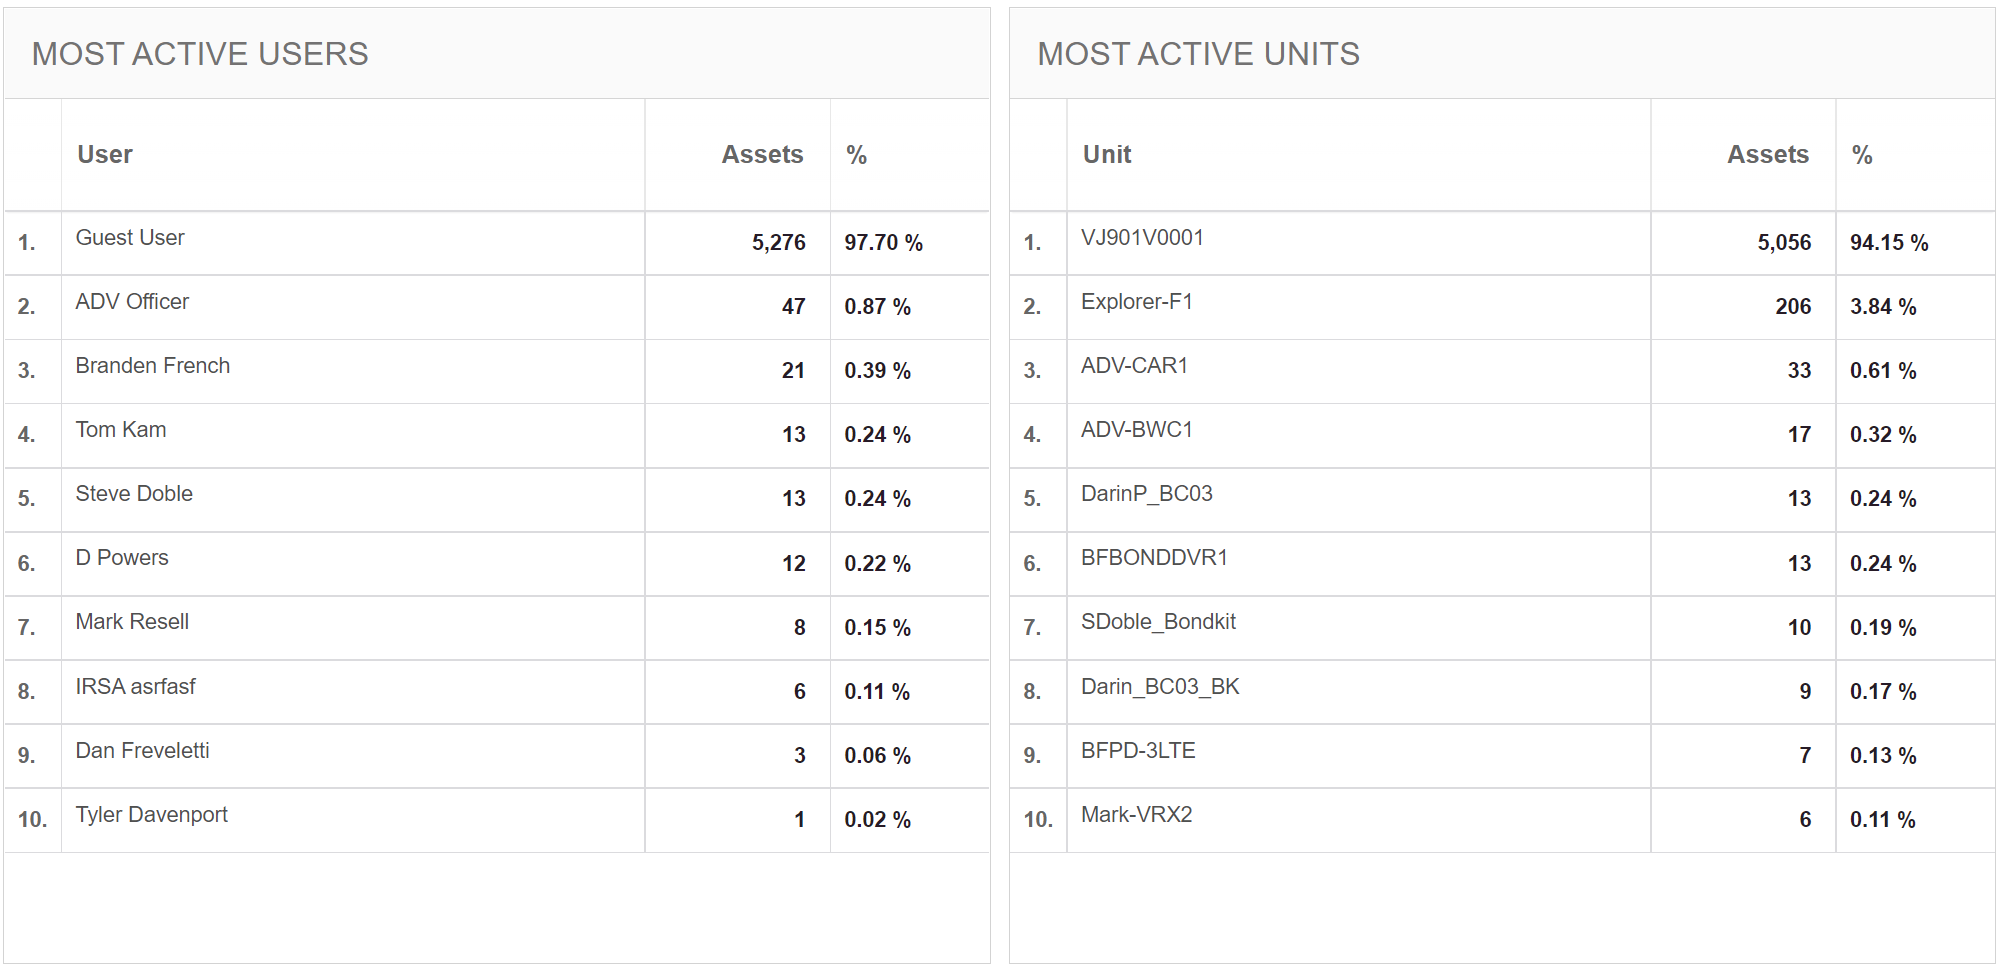
Most Active Users and Units
This shows the percentage of most active Users and Units respectively.
See the example below:
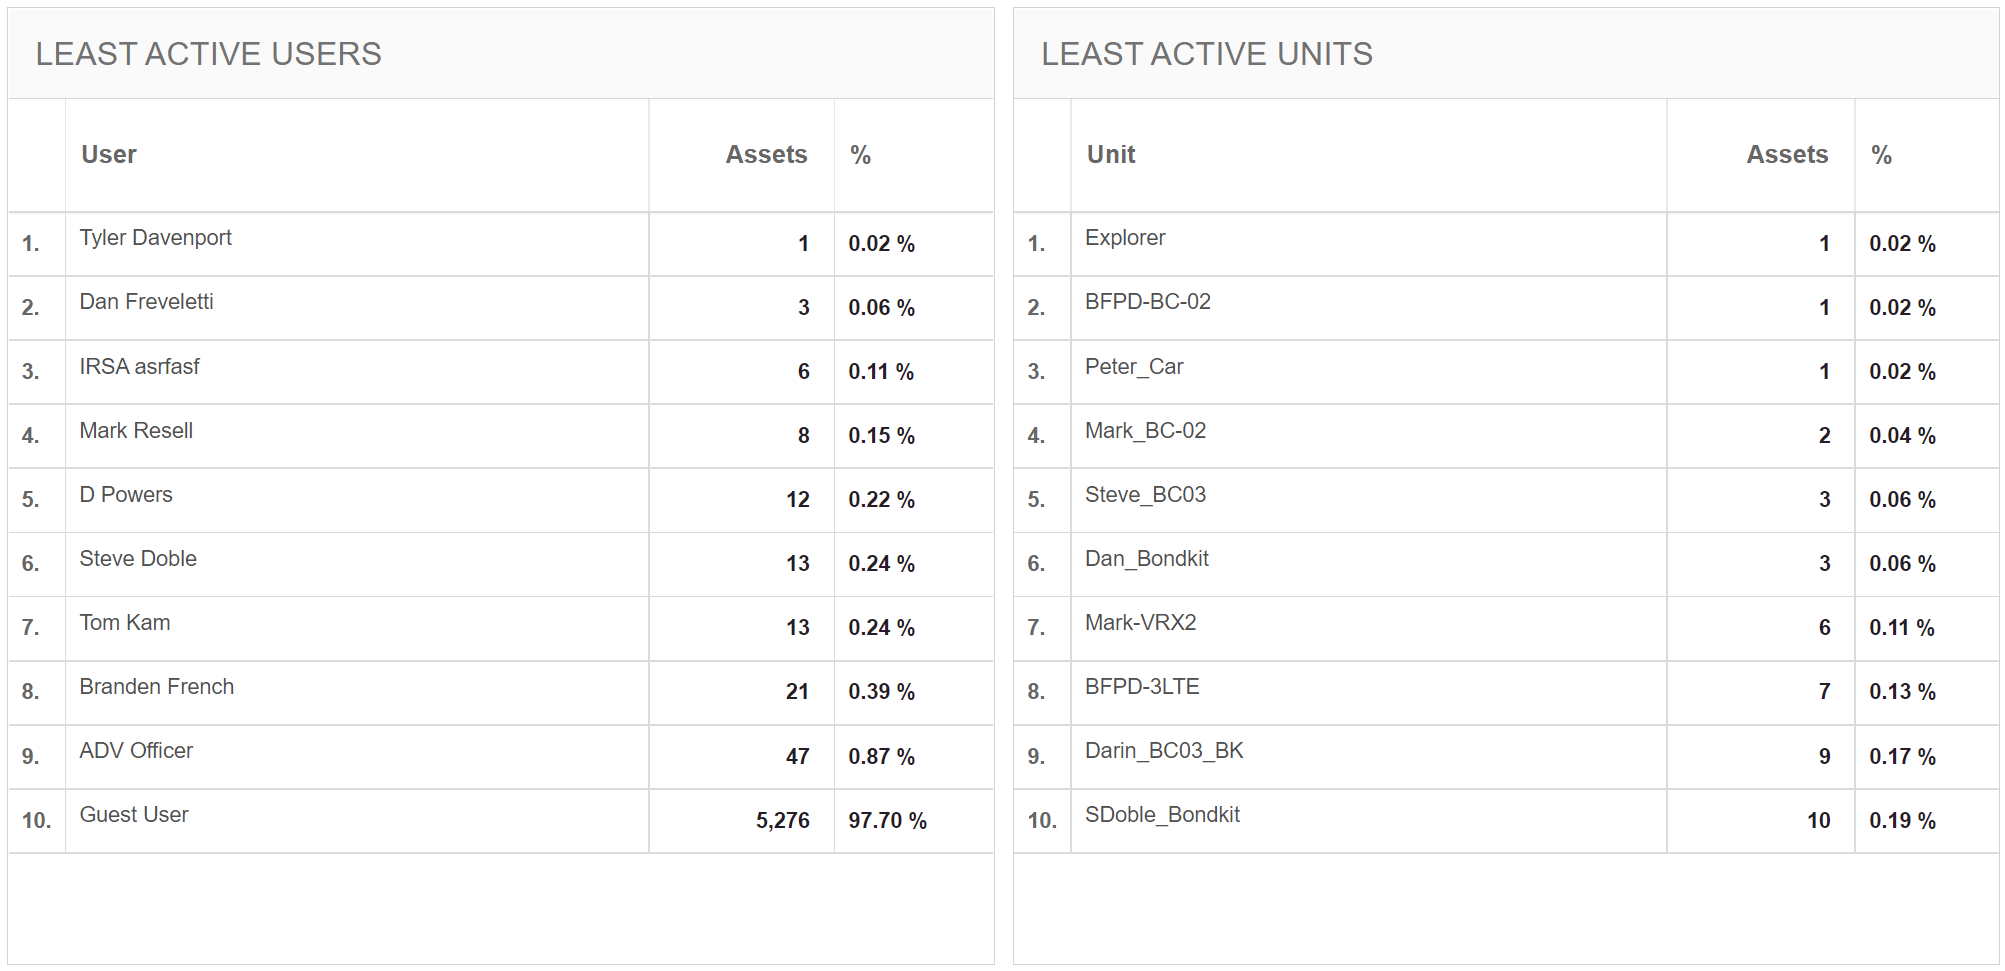
Least Active Users and Units
This shows the percentage of least active Users and Units respectively.
See the example below:
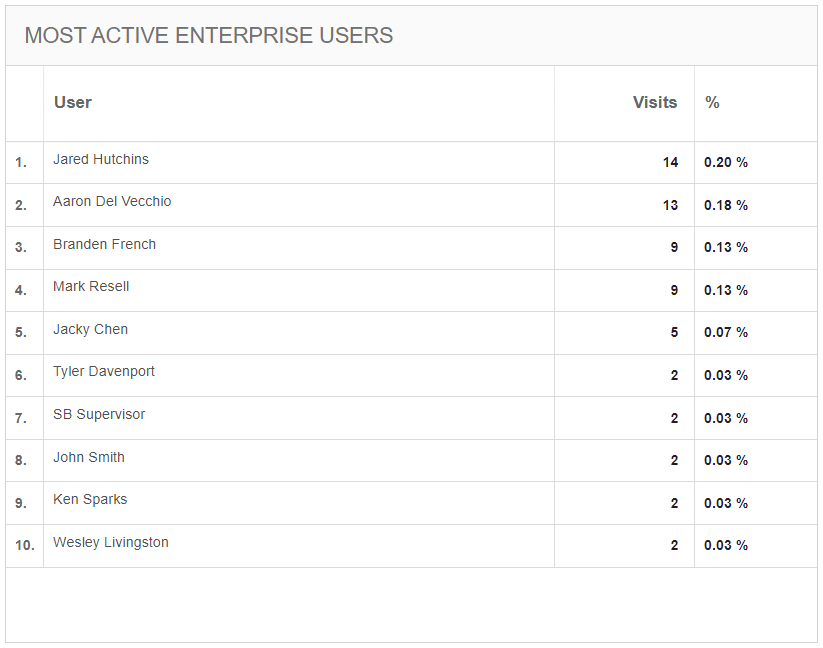
Most Active Enterprise Users
This shows the percentage of the most active Getac Enterprise Users.
See the example below:
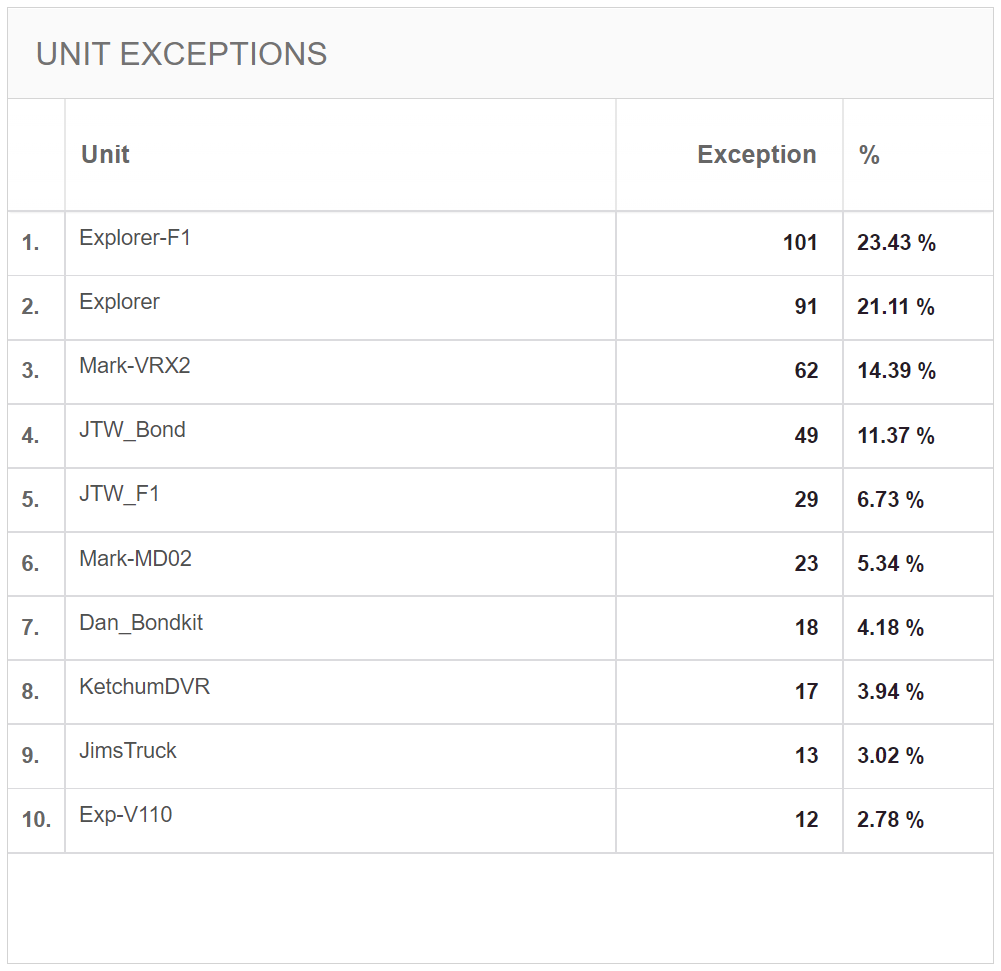
Unit Exceptions
This provides a visual representation of all exceptions and their corresponding percentage to the whole for the specified time.
See the example below: